
Dimensions
Understand the types of dimensions and how to create them.
Overview
A dimension is a design object that organizes unique values of an attribute into a list or a hierarchical structure for use as a filter or group by in your solution. They help you to break down information for analysis and see which parts of your business are experiencing success or challenges.
You can think of a dimension as populating the values on a chart axis. For example, if you group a visualization by the Organization dimension, Organization values populate the y-axis. Dimensions provide context to your data points and the metrics derived from that data. A dimension answers questions of who, what, where, when, why, and how for events in your data.
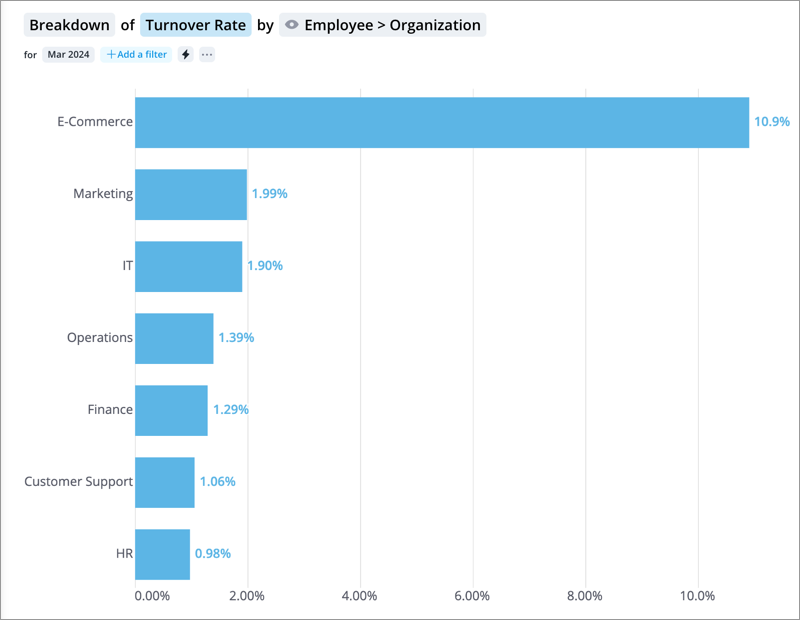
The following screenshot shows a Breakdown of Turnover Rate by Organization where the Organization dimension members, such as E-Commerce, Marketing, and IT, populate the visual's y-axis. This answers the who, where, and when questions for your company's Turnover Rate.
You can populate a dimension with data from a property in Visier or, if it's a leveled dimension, from one or more columns in your data file. For example, let's say you want to create a range dimension that organizes employees into age groups. In your data file, you don't have an Age Group column, but you do have a Birth Date column. You can use the Birth Date column to calculate employee ages in a property, such as Age in Months. You can then use the Age in Months property to organize employees into age groups in the Age Ranges dimension. For a leveled dimension example, let's say you want to create a dimension that organizes your employees by their location. In your data file, you must have location columns like Region, Country, State, and City to use in the leveled dimension.
Tip: To learn more, take the Visier University eLearning courses: Understanding Visier's data architecture and Creating dimensions.
Leveled dimensions
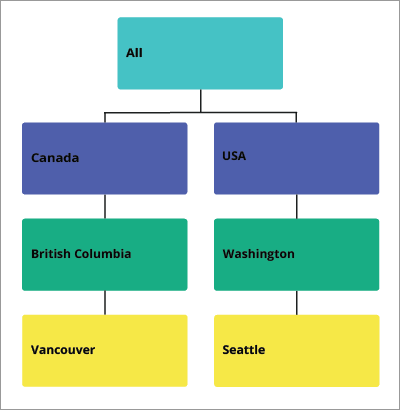
A leveled dimension organizes your data by levels. Leveled dimension have a fixed depth for every branch in the hierarchy, meaning each branch must have the same number of levels. In the following diagram, the Location dimension has three levels (country, province/state, city). Because leveled dimensions have a fixed depth for every branch in the hierarchy, each branch in the hierarchy must have a country, state, and city.
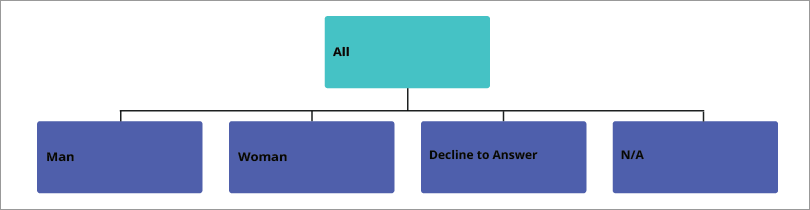
Although leveled dimensions often have multiple levels, you may create a leveled dimension with only one level. For example, Gender is a single-level leveled dimension. The only level is Gender that consists of multiple dimension members like Man, Woman, Decline to Answer, and N/A.
A leveled dimension may be shared among multiple analytic objects. For example, the Location dimension is shared by the subjects Employee and Candidate because they both have data for the subject members' locations.
When you create a leveled dimension in Visier, the platform creates a corresponding property. Because data is mapped to properties, not dimensions, there must be a property associated with a dimension to populate the dimension's data.
You can think of a leveled dimension as a container that tells Visier how its properties are structured by level, where the properties themselves hold the data. Consider Location, a dimension that has the levels Region, Country, State, and City. Each level is a property that you load data into and then Visier groups the properties through the leveled dimension's structure: Region > Country > State > City. Some dimensions only have one level, like Gender or Job Name. In this case, the corresponding property has the same name as the dimension. The property still holds the data and the dimension still informs the platform how to group by its property, however, there's only one level of data.
Leveled dimensions have the following characteristics in Visier:
- Provide one or more levels of detail to an analytic object. For example, the Location dimension provides many levels of details to the Employee subject, including Region, Country, Province, and City.
- Available as a group by in visualizations. For example, you can group Headcount by the Location dimension.
- Can be used in other objects, including metrics, calculated properties, custom dimensions, and concepts. For example, the Critical Employee selection concept uses the Critical Employee Status dimension to create a population of critical employees.
- Can optionally be applicable to more than one analytic object. For example, you can share the Location dimension with the Employee subject and Candidate subject.
To create, customize, or configure a leveled dimension, see Create a Leveled Dimension.
Parent-child dimensions
A parent-child dimension is a hierarchical dimension in which a member of the hierarchy is directly associated with another member in the hierarchy. For example, in a Supervisory hierarchy, the top-level parent is the CEO. The CEO branches down into their direct reports. Each direct report will have their own direct reports, and so on. At every branch, the number of reports will not be uniform and the depth of the tree may be different depending on the path. This creates an unbalanced hierarchy.
A parent-child dimension may be shared among multiple analytic objects. For example, the Organization dimension is shared by the subjects Employee and Requisition because they both have data for the subject members' organization hierarchies.
Parent-child dimensions have the following characteristics in Visier:
- Define a hierarchical relationship between members. For example, the Supervisory Hierarchy dimension defines the hierarchical relationship between the CEO and their direct reports, or between line managers and their direct reports.
- Available as a group by in visualizations. For example, you can group Headcount by the Organization dimension.
- Can optionally be applicable to more than one analytic object. For example, you can share the Organization dimension with the Employee subject and Requisition subject.
To create, customize, or configure a parent-child dimension, see Create a Parent-Child Dimension.
Range dimensions
A range dimension organizes numeric values into distinct groups for better visualization and filtering. For example, to group Headcount by Budgeted Direct Compensation, a range dimension is used to group the user-defined compensation ranges to visualize the number of employees at each compensation range, such as $50,000–$75,000.
Ranges are inclusive of the lower bound and exclusive of the upper bound. In a range of $50,000-$75,000, $50,000 is included in the range and $75,000 is excluded, meaning the range includes values from $50,000 up to $74,999.
Users can create, manage, and share their own ranges using the Range Set Manager if the default ranges don't meet their needs. For more information, see Range Sets.
Range dimensions have the following characteristics in Visier:
- Group numerical data in an analytic object. For example, the Age Range dimension groups employees by their ages (such as 20 to 25 or 45 to 50).
- Available as a group by in visualizations. For example, you can group Headcount by the Age Range dimension.
- Can be used in custom dimensions.
- Require an associated numeric property to provide data for the ranges. For example, the Age Range dimension uses the Age in Months calculated property to group employees into age ranges.
To create, customize, or configure a range dimension, see Create a Range Dimension.
Custom dimensions
A custom dimension is built manually to act as a standard for other dimensions to map into. For example, to map employee performance levels, a custom dimension references the Performance Rating dimension. This custom dimension has the groups High Performer, Mid Performer, Low Performer, and No Performance Rating.
Custom dimensions have the following characteristics in Visier:
- Define groups based on other dimensions' members. For example, the COVID-19 Vaccination Status Group custom dimension uses the COVID-19 Vaccination Status dimension to define custom groups such as Booster Shot, Fully Vaccinated, and Opted Out.
- Available as a group by in visualizations. For example, you can group Headcount by the COVID-19 Vaccination Status Group dimension.
To create, customize, or configure a custom dimension, see Create a Custom Dimension.
Member maps
A member map is a special object in Visier that unifies dimension members that exist in multiple analytic objects. For example, multiple source systems may use different names to describe the same location, such as USA and U.S.A. The members should be linked to help analysis. Member mapping is applicable to data cleansing members on the same dimension, such as mapping dimension member M to Male. With member mapping, these values become a single member of a dimension. This allows the user to define equivalents across source system dimensions to prevent duplicate members that mean the same thing in Visier.
You can create a member map in the Dimensions room in Visier. In the member map, you select the associated analytic objects and then link the dimensions that you want to map. For more information, see Create a Member Map.
Note: If you have mismatched dimension members, such as M in one source system and Male in a different source system, we recommend that you normalize the data with a transformation in an ETL pipeline prior to loading data in Visier. You can use extraction rules to ensure your member values align across multiple analytic objects. This allows you to contain all dimension members in a shared dimension, such as the Gender dimension shared with the Employee and Candidate subjects, rather than using a member map to normalize members after data loading.
If a shared dimension based on values normalized before data loading is not an option, we suggest using member maps, however, you must refresh the member map each time there are new member values.
Should I create a dimension?
Tip: Before creating a new dimension, check whether your Visier solution already contains the dimension you want. To find all dimensions in your solution, do any of the following:
- In a project, on the navigation bar, click Model > Dimensions. You can then filter the list of objects by dimension type and review the list.
- Download the Application Definition and refer to the Dimension sheet. For more information, see Download the Application Definition.
- Use Visier APIs to retrieve all dimensions. For more information, see Data Model API.
If you're creating new attributes for an analytic object, you might wonder when to create a dimension as opposed to a property or concept. If your attribute meets any of the following guidelines, a dimension is probably the right object for your data.
- The attribute groups data. For example, the Age Range dimension groups employees into specific age ranges based on the Age in Months property.
- The attribute will be used as a filter or group by in visualizations.
- The attribute can be used in other objects, like concepts or custom dimensions.
In addition to these criteria, review each dimension's characteristics to decide which type of dimension to create.
After you determine that you want to create a new dimension, you can create the dimension in a project in Model > Dimensions or Model > Analytic Objects.
In this section